Inelastic Demand
When the quantity demanded for a good does not change in response to price changes


What Is Inelastic Demand?
When an increase in price leaves the quantity demanded unchanged, or the quantity demanded does not change as much as the price, then the elasticity of that commodity is said to be inelastic. Thus, the quantity demanded remains static even if the price changes.
The percentage change in demand is less than the percentage change in price (ep < 1) in the case of inelastic demand.
So, if the price of an inelastic commodity goes up, then the quantity demanded by the customer remains almost the same. Conversely, if the cost of that good goes down, then the quantity demanded remains nearly the same.
However, this is only possible if the good is a necessity or does not have proper substitutes.
For example, when the price of salt rises, there is not much effect on the quantity demanded of salt as it does not have a substitute, and there is no adequate alternative for it.
Other essential items, like life-saving drugs and petrol, are also examples of “irreplaceable” products.
Fruits are also relatively inelastic in the sense that if the price of oranges increases, then people tend to buy more apples. Here, the quantity demanded of oranges decreases, but the quantity demanded of another type of fruit increases.
Thus, there is a change in demand within the group, but the overall demand tends to remain the same. The steeper the demand curve, the more inelastic the demand is.
Key Takeaways
- Inelastic demand occurs when changes in price lead to proportionally smaller changes in quantity demanded. This phenomenon is common with essential goods, addictive products, and items with few substitutes.
- The price elasticity of demand coefficient (ep) measures this responsiveness. Inelastic demand is characterized by an elasticity coefficient of less than 1, indicating low price sensitivity.
- Inelastic goods exhibit a price effect that outweighs the sales effect. This means that when prices increase, total revenue increases, and when prices decrease, total revenue decreases.
- Examples of goods with inelastic demand include basic necessities like food, medications, and utilities, as well as addictive products like cigarettes and gasoline.
Understanding Inelastic Demand
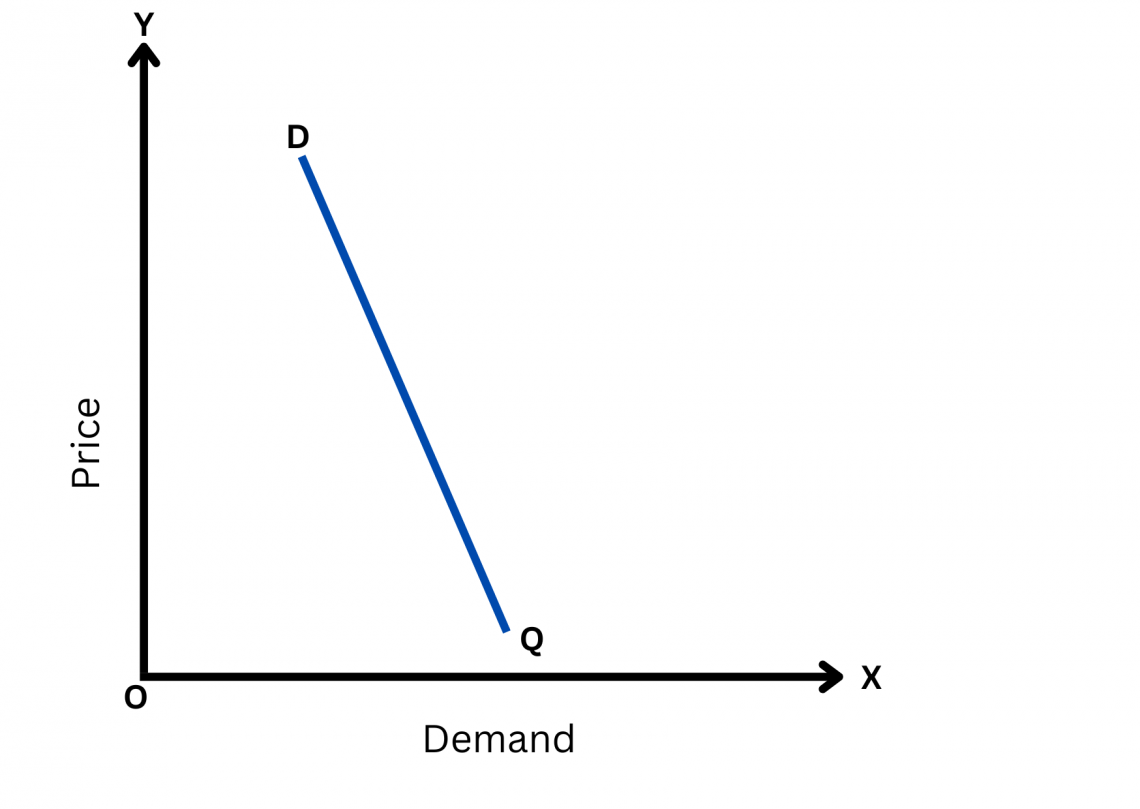
When the quantity demanded good does not change in response to price changes, it is called perfectly inelastic demand.
In this case, the demand curve would be a vertical line parallel to the Y-axis, representing the fact that no matter the change in price, the quantity demanded remains constant.

However, a perfectly inelastic good or service does not exist in real life. If there had been, then producers and suppliers would have kept the price as high as they wished, and customers would have still bought it.
The closest example to this would be air and water, as they are necessities for survival, but no one owns them.
When the percentage change in quantity demanded is less than the percentage change in the commodity's price, the demand is said to be less than unit elastic or comparatively inelastic.
In this case, the demand curve is a steep slope.
Inelastic Demand Example
The demand for necessities such as medications and food products is less than unit elastic. Let’s use oil as a case study to understand the concept of elasticity further.
However, in the long run, even their demand is elastic, as shown by OPEC in the 1970s and 1980s. On the other hand, the demand and supply for oil are pretty inelastic if evaluated in the short run.
More specifically, the demand is inelastic because buying habits did not change immediately with the price change. Supply is inelastic because the number of known oil reserves and oil extraction cannot be expanded quickly over a short period. Therefore, the demand and supply curves are relatively steep.
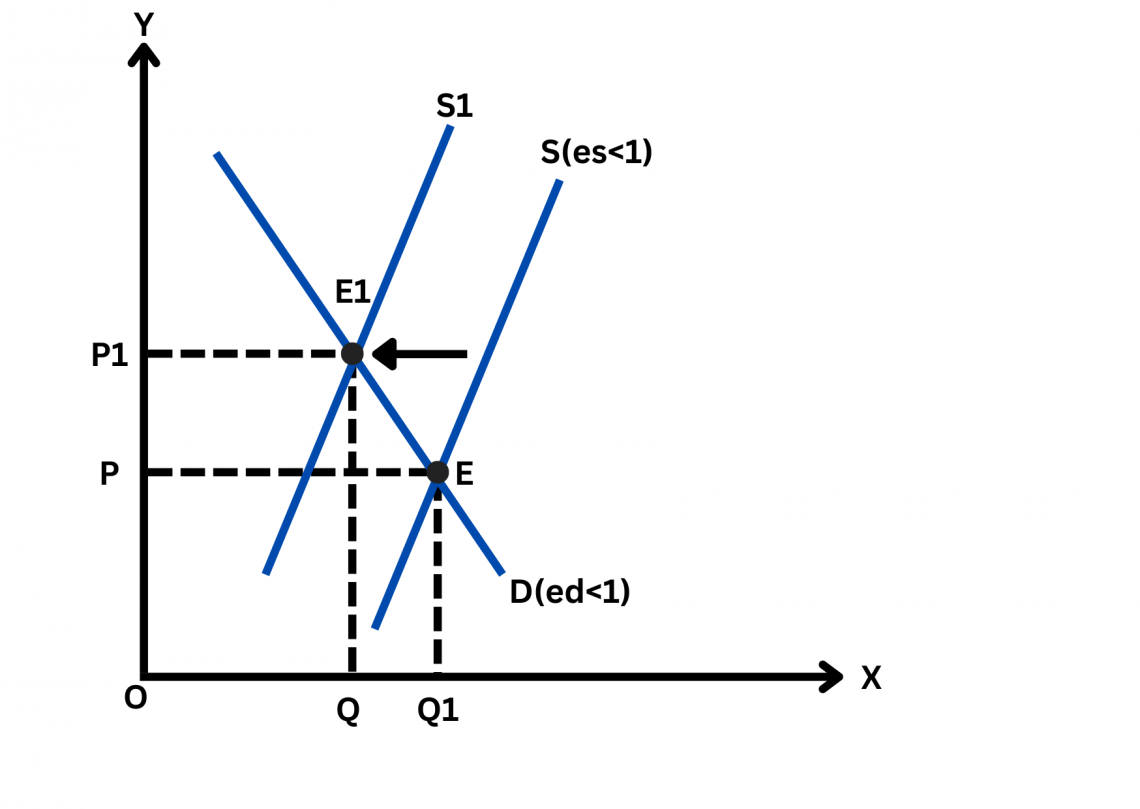
When the oil supply curve shifts leftward from S to S1, the price will rise from OP to OP1, as shown in the figure below. So, in the short run, OPEC can maintain prices well above the competitive level. That is, the price rise is much larger.
Where
- P - Old Price
- P1 - New Price
- Q - Old Quantity
- Q1 - New Quantity
- E - Old Equilibrium
- E1 - New Equilibrium
Still, the demand and supply of oil are elastic when we view it over a longer interval.
- The supply is elastic (es > 1) because the producers of OPEC tried to increase oil exploration by building new plants in response to the high prices.
- The demand curve is elastic (ed > 1) because consumers will respond to the higher oil prices by replacing oil with alternatives to avoid increased expenses.
Therefore, the leftward shift in supply from S to S1 causes a smaller rise in the price of oil.

As a result, the above analysis shows that OPEC succeeded in keeping a high oil price in the short run. In the long run, it led to smaller price increases or failed to maintain high oil prices.
When demand for a good is less than unit elastic, a drop in price decreases total expenditure. Additionally, a rise in price increases overall spending since the cost of the good and the total expenditure move in the same direction.
If a commodity's elasticity is less than one, a fall in price reduces total revenue, while a rise in price increases this total. Since the change in demand is proportionately less than the price change, the total income from the commodity varies directly with the price change.
Therefore, in the case of inelastic goods, price effect > sales effect.
If the price of a commodity decreases from $5 to $4 and consequently the quantity demanded increases from 100 to 120, then the total revenue decreases from $500 to $480.
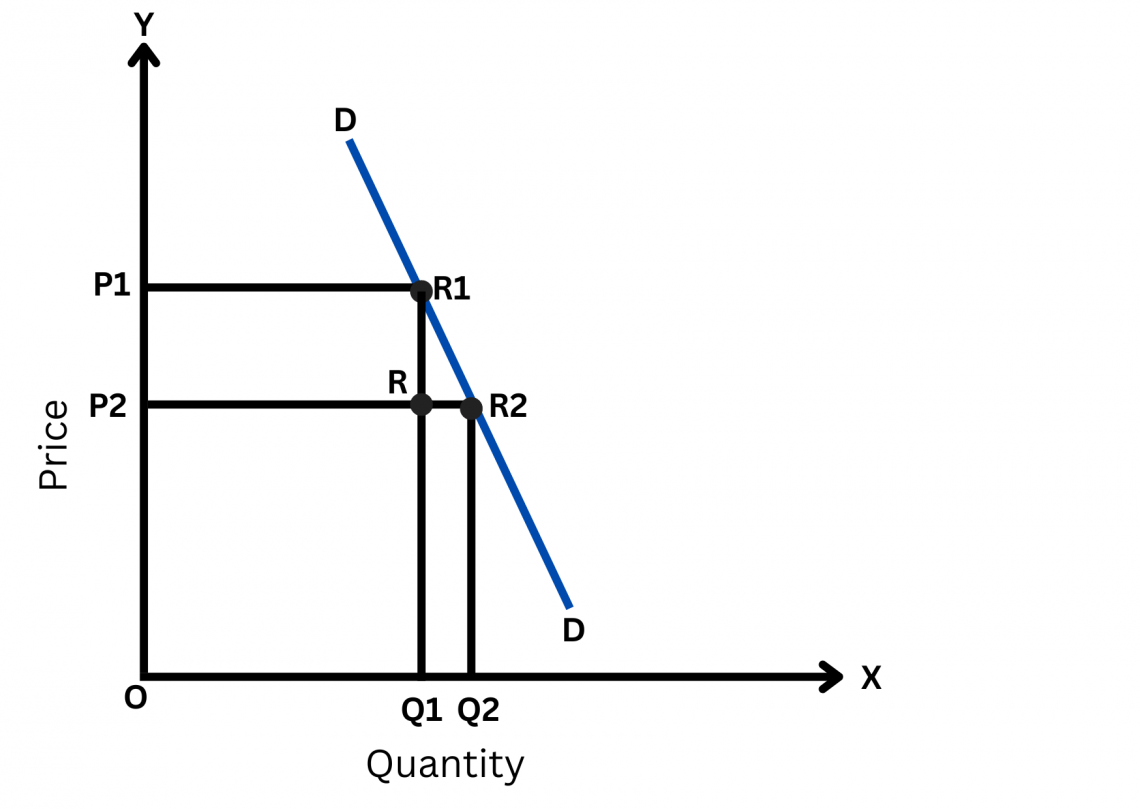
In this figure, the price has come down from OP1 to OP2. Consequently, the quantity demanded has increased from OQ1 to OQ2.
OP1R1Q1 is the total revenue before the fall in the price, and OQ2R2P2 is the total revenue after the fall in the price.
P2P1R1R is the reduction in the total revenue resulting from the fall in the price. On the other hand, Q1RR2Q2 is the increase in total revenue resulting from the increase in quantity.
Here, the revenue reduction is more significant than the revenue increase. This is because the total revenue after the price fall has decreased.
Elasticity of Demand Formula
The formula for the elasticity of demand according to the percentage method:

Elasticity (ep) = (Δq/q) / (Δp/p)
= (Δq/q) * (p/Δp)
= (Δq/ Δp) * (p/q)
Where,
- Δq is the change in the quantity
- Δp is the change in the price
- q is quantity
- p is price
Numerical Example Of Inelastic Demand
Let us take an example. If the price falls from $60 to $58 and consequently, demand increases from 200 to 210. Then,
Δq = 210 - 200 = 10
Δp = 60 - 58 = 2
p = 60, q = 200
Elasticity (ep) = (Δq/ Δp) * (p/q) = (10/2) * (60/200) = 1.5
It should be noted that (price) elasticity of demand is negative. The rationale is that a commodity's demand and price move in opposite directions. Therefore, any changes to one of them must be negative.
Therefore, anytime the price elasticity is stated to be 3.5, it is actually -3.5 and is just indicated by a positive figure for simplicity.
The minus sign shows only the inverse relationship between price and elasticity before the elasticity value. The elasticity coefficient is arranged in order of absolute value.
As a result, whereas algebraically, the opposite would be true, an elasticity of "-3" is more substantial than one of "-2".
Suppose the price of commodity ‘Y’ changes from $2 to $12 and, consequently, demand decreases from 10 units to 8 units. Then
Elasticity of demand = (Δq/ Δp) * (p/q) = (2/10) * (2/10) = 0.04
Thus, the elasticity of commodity ‘Y’ is inelastic as it is less than 1.
Elastic vs. inelastic demand
Regarding how customers react to price fluctuations, there are two extremes on the spectrum: elastic demand and inelastic demand. The two are contrasted as follows:
| Characteristic | Inelastic Demand | Elastic Demand |
|---|---|---|
| Definition | Changes in price result in proportionally smaller changes in quantity demanded. | Changes in price result in proportionally larger changes in quantity demanded. |
| Price Sensitivity | Low price sensitivity | High price sensitivity |
| Price-Quantity Relationship | Steep demand curve | Flatter demand curve |
| Total Revenue Response | When the price increases, total revenue increases; when the price decreases, total revenue decreases. | When the price increases, total revenue decreases; when the price decreases, total revenue increases. |
| Examples | Basic necessities (e.g., food, medications, utilities), addictive products (e.g., cigarettes, gasoline). | Luxury items (e.g., designer clothing, high-end electronics), non-essential services (e.g., movie tickets, restaurant meals). |
applications of inelastic demand
Applications of inelastic demand can be found in a wide range of sectors and financial environments.
The following are some important applications:
1. Healthcare Services
There is an inelastic demand for some medical treatments and operations, particularly those that are thought to be life-saving. Demand for medical treatment is often consistent because patients frequently need it regardless of price fluctuations.
Healthcare providers may take advantage of this inelasticity by raising the cost of necessary procedures or drugs without seeing a large drop in patient demand.
2. Pharmaceuticals
There is frequently an inelastic demand for prescription drugs for long-term ailments or serious illnesses. Patients may be willing to pay greater costs in order to preserve their well-being since they depend on these medications to manage their medical issues.
Note
Because demand for pharmaceuticals is inelastic, pharmaceutical corporations may utilize their market dominance to set prices at levels that maximize revenue.
3. Utilities
The demand for essential services like gas, water, and electricity is usually inelastic. Customers are less sensitive to price adjustments because they depend on these services for daily needs.
Utility providers can use this inelasticity to boost rates without worrying about losing a sizable portion of their clientele. Regulators, however, frequently keep an eye on utility prices to thwart monopolistic practices and guarantee consumer affordability.
4. Basic Food Items
There is typically an inelastic demand for staple foods such as bread, rice, and basic produce, especially in low-income areas where people spend a large percentage of their income on food.
Note
Demand patterns for various products may remain largely steady even if prices rise because consumers may still need to buy them.
5. Tobacco and Alcohol
Despite price rises brought on by taxes or regulatory actions, products such as cigarettes and alcoholic beverages frequently show inelastic demand.
The inelasticity of demand for certain commodities is a result of addiction and habit-building, as consumers may keep buying them even when prices increase.
6. Luxury products
Among wealthy consumers, there may be an inelastic demand for luxury products, especially those that are connected to status or prestige. Price rises for luxury goods could not have a big effect on demand since buyers cherish the exclusivity and prestige that come with them.
Conclusion
Inelastic demand significantly influences pricing tactics, market dynamics, and consumer behavior. Businesses must comprehend this concept to estimate sales, manage pricing, and allocate resources.
Policymakers must also consider inelastic demand when creating rules that guarantee affordability, equity, and consumer welfare.
Through an understanding of the traits and uses of inelastic demand, decision-makers can optimize economic efficiency while also attending to societal demands and concerns.
The idea of inelastic demand is a cornerstone of economics and business management, whether it's applied to the provision of necessities or the control of market competition.
Inelastic Demand FAQs

When a change in price leads to a subsequent change in the quantity demanded, the demand is said to be elastic.
All goods have elastic demand if they have substitutes like coffee, tea, car, etc. Hence, most of the goods and services we consume have elastic demand.
In the long run, almost all goods have elastic demand.
Alfred Marshall first used the concept of price elasticity of demand in economic theory to describe the degree of responsiveness in demand for a good to a fall in its price.
According to him, “the elasticity (or responsiveness) of demand in a market is great or small as the amount demanded increases much or little for a given fall in price and diminishes much or little for a given rise in price.”
The ratio of the proportionate change in the quantity of a good or service demanded to the proportionate change in the consumer's income is known as income elasticity of demand.
Thus, the income elasticity of demand can be calculated by dividing the percentage change in the quantity demanded of commodity ‘X’ by the percentage change in the consumer's income.
The cross elasticity of demand measures how responsive demand for one good is to changes in the price of a substitute or complementary good.
It is measured as the ratio of the percentage change in the amount demanded of one commodity to the percentage change in the price of another commodity.

Free Resources
To continue learning and advancing your career, check out these additional helpful WSO resources:

or Want to Sign up with your social account?