Power Query
Data transformation tool used in Excel and Power BI that cleans and transforms data files from multiple sources


What is a Power Query?
Power Query is a data transformation tool on Excel and Power BI that cleans and transforms data files from multiple sources.
It is a one-stop shop for data formatting, after which the dataset can be used for analysis. In most cases, raw data cannot be used to draw insights because it poses various issues, such as:
1. Inconsistent Data
A certain column of data could have incomplete or missing entries; this would lead to inaccuracies when analyzing said column. Similarly, outliers and erroneous observations would distort the data.
2. Lack of Structure
Raw data's unstructured or poorly structured nature would make the organizing and sorting process time-consuming, especially when working with vast datasets.
3. Data Integration
Not every data file is compatible with Excel, and manually converting each file to Excel’s preferred format would be difficult.
4. Privacy
There are occasions when a raw dataset contains sensitive information which must be protected; this is challenging when the data must be shared in the future.
This is where Power Query comes in, and it automates tasks such as data cleaning, transformation, and integration which are crucial in addressing the problems posed by raw data.
The result is processed data that is structured, accurate and consistent. Now it is much easier to analyze observations within a dataset reliably.
Several data organizing operations are deployed to return clean data through the Query tool, namely filtering, sorting, merging, and removing duplicates, as well as more sophisticated transformations such as splitting columns and transposing.
Key Takeaways
- Power Query is a vital tool in Excel and Power BI, automating data cleaning, transformation, and integration.
- Available as an Excel add-in, Power Query streamlines data management tasks through its editor, offering functions like filtering, sorting, and advanced transformations across different tabs.
- Components like Query List, Formula Bar, Data Preview, and Settings aid in managing queries, expressing transformations, and tracking applied steps.
- Power Query is crucial for industries dealing with large datasets. It saves time, reduces human error, and enhances data analysis.
Understanding Power Query
Power Query is a data transformation and connection tool in Microsoft Excel and Power BI used to import, transform, and load data from various sources for analysis and reporting.
One of its key applications is rooted in finance. Accountants must often simplify financial statements and other relevant files from external databases.
This can be eliminated through Query tool, which streamlines data preparation tasks and helps shift the focus toward strategic and analytical aspects of accounting.
Likewise, financial analysts could utilize the data transformation tool to improve efficiency and accuracy.
Firstly, it helps provide different views of financial data through filtering, sorting, and pivoting, allowing an analyst to identify price or return trends quickly.
Secondly, as it is important to trace the origin of data and the steps taken to manipulate it for complex financial models, the Query tool offers an audit trail showing the formulae and assumptions used to construct the model, making the financial analysis more reliable.
Using Power Query in Excel
The Query tool is an Excel add-in that can be downloaded from Microsoft’s official website.
Once this is completed, it will appear in the data tab of Excel under ‘Get Data.’
To open Query tool, one must expand the Get Data section and click on ‘Launch Power Query Editor.’ This will open up a sample Power Query workspace.
The editor contains a ribbon, query list, formula bar, data preview, and settings tab. These individual components have specific properties broken down further using an image of the workspace screen.

The first thing to notice is that it is an empty editor with no data added. An example with data will be included later in the article, but at the moment, it is important to understand the function of each element in the Query Editor.
The workspace ribbon comprises five distinct categories; Home, Transform, Add Column, View, and Help.
1. Home
The home tab allows you to manage data loaded onto the PQ editor. One can add columns, reduce rows or sort the data through filters.
2. Transform
Here there are options to transform and clean the data. Actions such as transposing, merging or splitting columns, replacing values, and pivoting data are also available.
3. Add Column
This lets you add new columns to your data while providing formula commands, scientific notation, and rounding for numbered observations.
4. View
It can help in changing the layout of the Query tool Editor and enables you to switch between step script or query script (the script option can also be turned off).
5. Help
Whenever one is stuck in the data transformation process, they can use this section as a reference by looking at the Query tool blog or submitting any issues faced to ‘Power Query for Excel help.’
Other Components of Power Query
Furthermore, the other components of the tool include a Query List, Formula Bar, Data Preview, and Settings.
1. Query List
A query list is a pane on the left-hand side that lists all the queries in the existing workbook; one can browse through different queries in this area.
To edit a query, you must right-click on it, giving various options such as renaming, duplicating, rearranging its order, and converting it to a function.
Similarly, right-clicking on the Query List itself will give the option of creating a new query from a file or database.
2. Formula Bar
This is the section where data transformation steps are expressed in the M coding language.
The code can be directly edited here without an advanced editor. If the M code generated is too long, the option to expand the formula bar is also there.
3. Data Preview
As new data transformation steps are added, one can observe these changes in real-time by previewing the data post-transformation.
It can also be used to display the data entered in a spreadsheet format simply; once this is done, relevant data transformation and cleaning steps can be done for specific columns by clicking on them.
4. Settings
When looking at query settings, one must look at applied steps that let you track all the transformative actions taken on the data.
It is possible to add, delete or edit steps, and clicking on them will redirect you to the specific transformation used in that step. Additionally, one can rename or reorder steps in the settings tab.
Now, the newly processed data is ready to be loaded onto Excel. This can be accomplished by clicking on the “Close and Load” button in the Home tab; it provides options on how the data can be viewed in a workbook (Table, PivotTable Report, PivotChart).
Next, one has to decide where the data should be stored. It can either be in an existing worksheet or a new worksheet can be created for it.
Note
Once the selection is complete, the newly processed data automatically appears on a new or existing Excel worksheet. It can now be used for further analysis and exploration.
Power Query Excel Example
A sample raw dataset is taken to demonstrate the data transformation actions possible through the Query tool, which will subsequently be converted to a cleaner version for further analysis.
For this example, a dataset on Kaggle depicting the top 100 songs every year from 1992 to 2014 is chosen. The data has a relatively low usability score of 6.47, as per Kaggle, which means Query tool can help clean and transform it.
This is what the data looks like when loaded on the Query Editor:

It is interesting to note that the query list got filled up with the data entered, the initial applied steps are shown under query settings (first row used as headers, Rank and Year columns changed to numerical values), and the formula bar describes the applied steps mentioned.
One key function is the ability to delete rows or columns in bulk without manually going through a vast dataset. This can be accomplished by clicking on remove rows in the Home tab.
For instance, if the goal is to only find the top 100 songs for each year in the 2000s, then the 1992 to 1999 or 2010 to 2014 data is irrelevant. To get the desired search field, one has to delete rows from the top and bottom.
Since 1992 to 1999 consisted of 8 years, 800 rows from the top must be deleted. Similarly, from 2010 to 2014, 500 rows of data were removed.

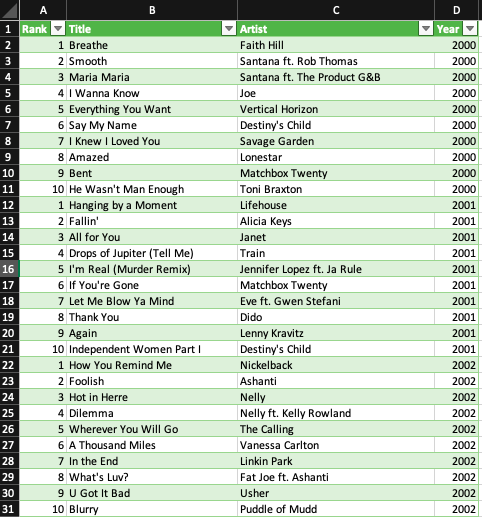
Now the data begins in 2000 and ends in 2009; notice how the rows are displayed as 1000 observations instead of ‘99+’ observations before the transformation.
Moving on, if the next task is to group Rank 1 songs and display them at the top, it can be done by clicking on ‘Rank Column’ in the Add Column bar.
Once done, it will return a dataset where the ranks are clubbed together rather than a year of release. The rank column can then be sorted to show the highest ranks at the top.
However, an additional column called Rank 2 was created in this process which is not required and can be deleted to further clean the data.

Finally, a new data table with songs ranked at one can be seen at the top, while rank 100 songs will be found at the bottom.
Additionally, the artists’ names are unnecessarily long, as individuals who feature in a song are also mentioned. Thus, this data can still be optimized.
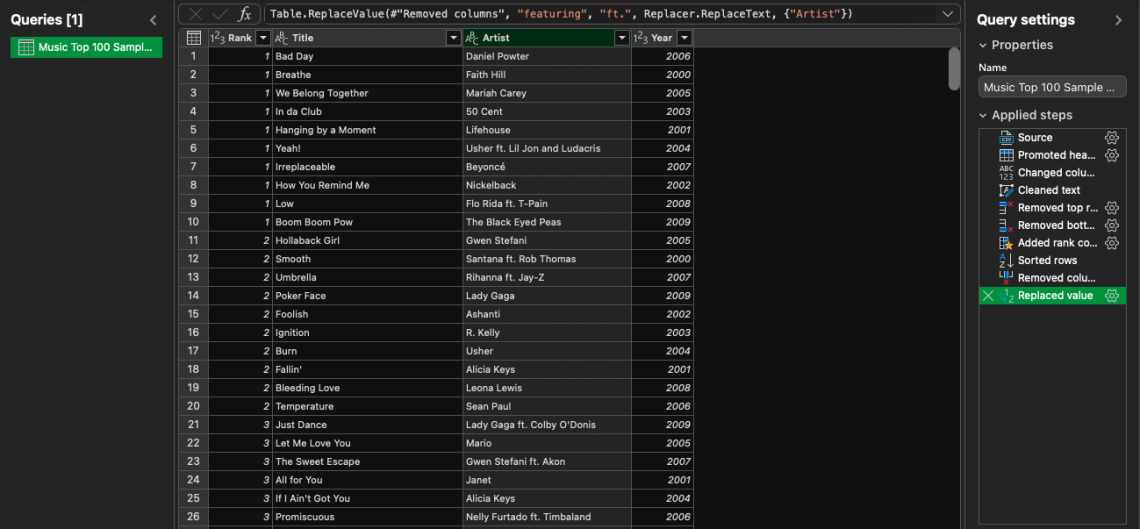
Replacing values in the Transform tab is a quick way to cut down the length of artist names to make them look more presentable.
The word ‘featuring’ can be simply replaced with ‘ft.’ to eliminate lengthy artist names and add some neatness to the data.
After selecting the column where values are to be replaced, the following window opens where one can make the necessary changes under the artist's name.
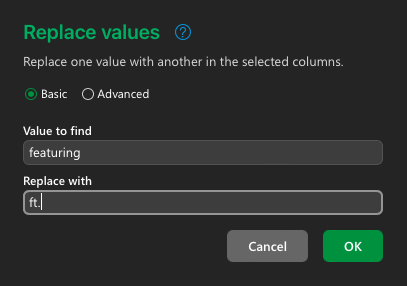
The artist names do not look as cluttered now and are not extending outside the frame of the artist name column.
Text Transform is another function that can add neatness and uniformity to data; when right-clicking on a column and selecting ‘Transform Column,’ the text transform option opens up.
This can be used in various ways: it can capitalize the entire column to uppercase, or one can direct it to capitalize the first letter of each word. Similarly, columns can be made fully lowercase, and each word's length can also be found.
Hence, text transformation is a key tool when dealing with text-related data.
The data is almost ready for analysis, but an additional step is required. The songs are sorted by rank within the desired time frame of the 2000s, but the lower-ranked songs might not be important when further analyzing the period.
Therefore, lower-ranked songs could be taken out to provide a concise view of the top songs in the 2000s and improve the functionality of a file previously bogged down by clutter.
This can be achieved by removing the bottom 900 rows of the data (remove bottom rows function) to provide the top 10 ranked songs for each year.
It is much easier to navigate through the top 10 songs each year in the 2000s after implementing the data transformation tools available through the Power Query editor.
To conclude, the dataset can now be loaded onto Excel for analysis. This is done by hitting the ‘Close and Load’ button on the top left of the Home tab. It automatically opens up the processed data table in Excel.
The data above looks entirely different from the raw dataset the example began with; it can now be interpreted in multiple ways to derive relevant insights on popular songs released in the 2000s.
Note
If there is a specific data transformation step that needs to be changed, one can simply reopen the Editor and cross it out under applied steps.
Importance of Power Query
Overall, the Query tool is an incredibly important tool in any industry where individuals have to work with large datasets.
There are several reasons why it is preferred over manually sifting through data on Excel, including:
1. Saving time and reducing human error
Going through a dataset with numerous rows and columns can be time-consuming.
As seen in the previous example, the dataset had over 2000+ rows, and it is difficult to make individual changes when the data is that vast.
The Query tool was able to reduce the data to 100 rows through a few simple steps; this made it easily digestible, in turn highlighting relevant observations from a large selection of data.
If the following steps were executed in Excel, it would take much longer to execute, and there would also be greater scope for error.
Additionally, the human eye may miss a few inconsistencies in the data, but the Query Editor will always catch them if relevant instructions are given.
2. Being compatible with multiple data sources
Data comes in many different formats, and many of them cannot be directly used for analysis. For instance, CSV, HTML, or JSON files often return missing data when opened in Excel.
This phenomenon is problematic as the best way to derive insights from a dataset is through Excel. And this is how Power Query comes in handy, as it can access, combine and transform data from multiple sources.
3. Being reusable
Once data cleaning and transformation are completed on the Editor, it quickly generates a new processed dataset and removes the applied steps taken from the home screen.
Creating a new query is straightforward and can be done from scratch; if the old query has to be referred to, one can simply open it under the Query list to see the previously stored applied steps.
4. Ensuring enhanced Data Analysis
Combining data from different sources on the Query tool can lead to novel insights and improved analysis.
Usually, one tends to analyze data sets in the same format, but using this transformation tool allows for more informed decision-making by adding parameters that were not previously considered.

Free Resources
To continue learning and advancing your career, check out these additional helpful WSO resources:

or Want to Sign up with your social account?